
A Pragmatic Crop Model for Kidney Bean Agriculture
As the demand for water and land from different industries and municipalities continues to grow, farmable land and available water are becoming increasingly scarce. The confluence of these circumstances pressures farmers to generate higher yields without increasing their resource consumption, thus compelling them to heighten their efficiency. In response, the agricultural technology sector has sought to improve farming equipment, data collection and analysis, and best practices. But given the persistent and shifting pressures of consumerism, such technology must constantly evolve to help farmers face these dynamic challenges.
Chippewa Valley Bean is the farming industry’s leading processor of dark red kidney beans. The Wisconsin-based business employs a team of agronomists who advise farmers on water use efficiency, nutrient plans, weed management, disease prevention, and harvest techniques. Chippewa Valley Bean approached us with the idea of creating a mathematical model specifically for the kidney bean crop in the regions where they operate — from the sandier soils of central Wisconsin to the richer prairie earth of central Minnesota.
Because soil type has important ramifications for water efficiency, the agronomists specifically wanted a model to help them manage water resources when growing dry beans in certain types of soil. Current models lack specificity in terms of both soil composition and varietal of kidney bean. Moreover, they either require very large data sets for input, necessitate expensive computing resources, or are too simple and rely on heuristics that do not translate to an agronomist’s specific circumstances. Most existing models are hence not practical for use by agronomists and their growers.
A robust model that allows for varying inputs—especially soil parameters—would enable agronomists to analyze the impacts of their strategies, help them design new experiments for future studies, and ultimately increase agronomic efficiency. Here, we develop a pragmatic approach that is specific to the needs of dry bean growers in several Wisconsin and Minnesota counties. Our model seeks to establish a direct relationship between inches of water and kidney bean yield, as well as determine kidney bean sensitivity to irrigation strategies.
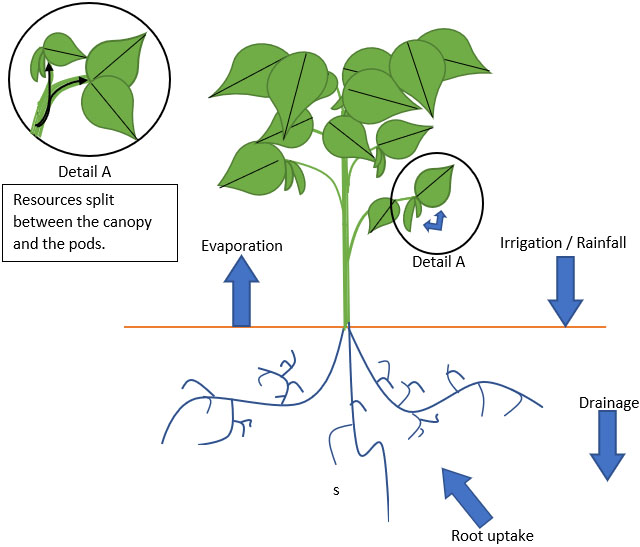
We approach this problem with an ordinary differential equation (ODE) model that tracks the movement of water through a system that consists of soil, plant canopy, and beans (see Figure 1). In this system, \(\phi\), \(Z\), and \(S\) respectively represent porosity, root depth of the soil, and saturation percentage; as such, \(\phi Z \dot{S}\) signifies the rate of change of the amount of water in the soil. We also track the fraction of the plant canopy that covers the ground—denoted by \(C\)—and the biomass of beans (or yield) \(B\).
Water enters the soil via irrigation and rainfall. Some of it drains through the soil at a rate \(K_{\textrm{sat}}S^d\) that depends on soil parameters, and some of it evaporates at a rate that depends on both the amount of exposed soil not covered by plant leaves/canopy and the amount of water in the soil: \(k_{e} ET_0 K_e(S) (1-C)\). The plant takes up water from the soil in a process known as evapotranspiration that depends on the amount of leaves or canopy cover: \(k_{b} ET_0 K_w(S) C\). Environmental factors like temperature and humidity further affect the evapotranspiration rate and are reflected in the reference evapotranspiration term \(ET_0\), which we calculate via the Penman-Monteith equation [1].
![<strong>Figure 3.</strong> Model fit to canopy data from [3]. Figure courtesy of the authors.](/media/bcwl2sgb/figure3.jpg)
Once the water moves into the plant, a fraction \(f_b\) goes into growing the beans; the term \(r_{BG}\) represents the plant’s efficacy at converting water to bean biomass. These parameters are time dependent and can change based on the soil’s nutrient content. The rest of the water helps to grow and maintain plant canopy. Canopy growth is determined by the water use efficiency parameter \(\omega\), which describes the plant’s ability to grow canopy per unit of water absorbed. To build the model’s maintenance term \(\omega k_{b} ET_0 C^2\), we assume that the canopy experiences logistic-type growth with a limiting value of 100 percent coverage under ideal growing conditions, before the plant flowers, and when no bean growth occurs. At the end of the growing season, plants undergo a programmed death called senescence that we model with another decay term in the form \(\gamma C^2 (t - t_{\textrm{sen}}) H(t-t_{\textrm{sen}})\). Here, \(\gamma\) is a senescence constant, \(t_{\textrm{sen}}\) is the time of senescence, and \(H\) is the Heaviside function.
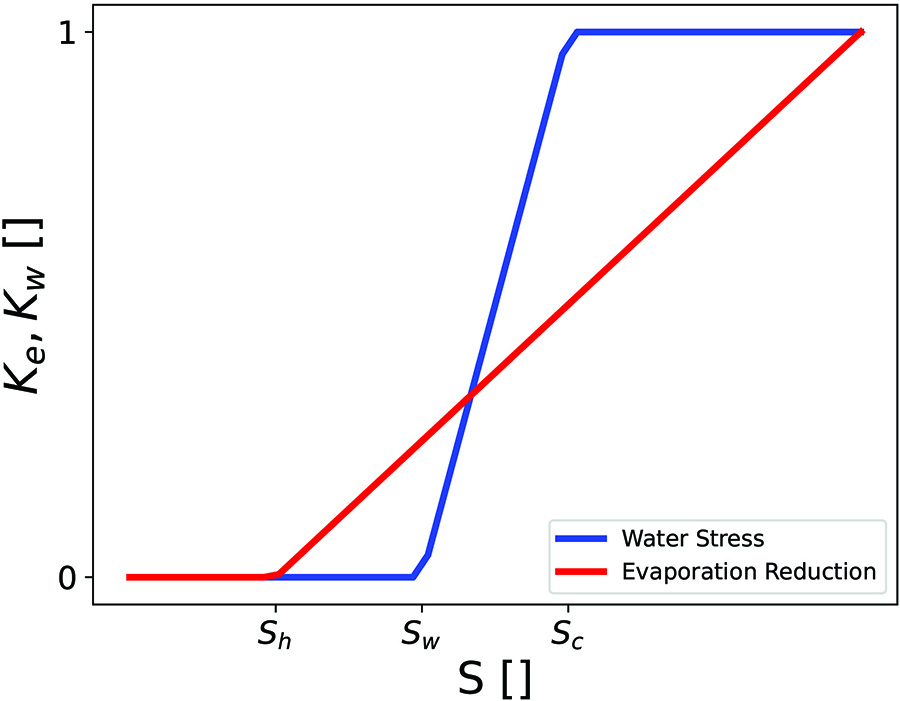
The final components of the model are the soil stress functions \(K_e(S)\) and \(K_w(S)\), which modify our evaporation and evapotranspiration terms to account for the physical interactions between water and soil in the pore spaces. When the soil holds a sufficient amount of water, evaporation and evapotranspiration proceed as expected. But when soil saturation is very low and not much water is present, the soil typically retains its water, and little reaches the air or plant. Our model includes a hygroscopic point \(S_h\): a saturation value below which no evaporation occurs. For transpiration, we define a wilting point \(S_w\)—below which plants absorb no water—and a stomatal closure value \(S_c\), above which plants undergo full transpiration. Between these values, we assume that soil stress affects plant transpiration linearly [2]. Figure 2 depicts the stress functions.
Combining all of these ideas, the following three ODEs represent our model:
\[\begin{eqnarray} \phi Z \frac{dS}{dt} &=& I - K_{\textrm{sat}} S^d - k_{\textrm{ev}} ET_0 K_e(S) (1-C) - k_{b} ET_0 K_s(S) C \\ \frac{dC}{dt} &=& \omega k_{b} ET_0 C K_s(S) (1 - f(B) ) - \omega k_{b} ET_0 C^2 - \gamma C^2 (t - t_{\textrm{sen}}) H(t-t_{\textrm{sen}})\\ \frac{dB}{dt}&=& r_{BG} k_{b} ET_0 K_s(S) C f(B). \end{eqnarray}\]
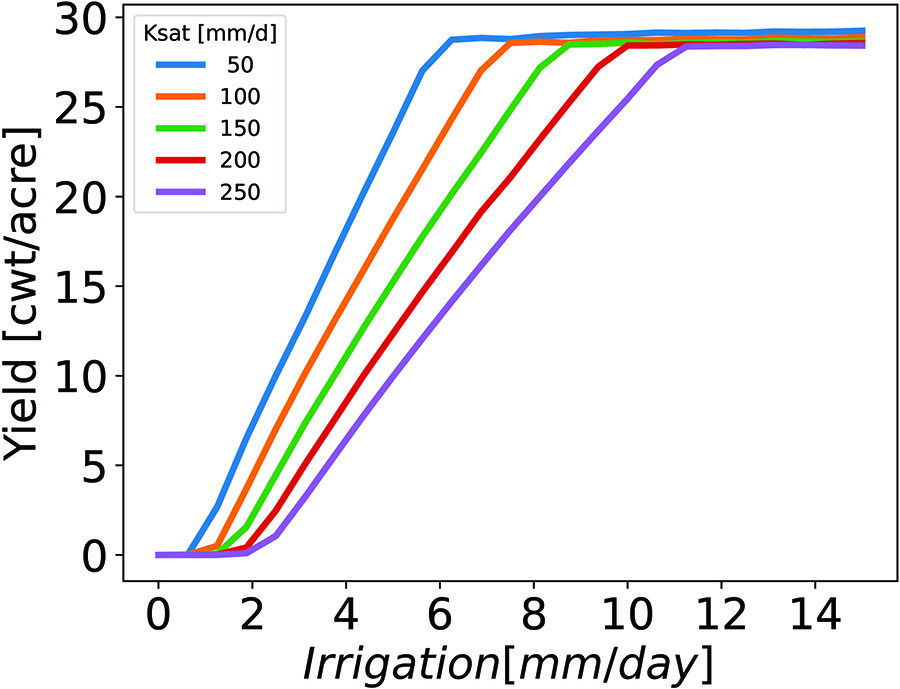
Because of limited available data, we choose to fit only the water use efficiency parameter \(\omega\) to canopy data, which was collected from an environment with controlled irrigation and minimal rainfall [3]. Our results reflect this fit value, values from existing literature, and data from local agronomists. Figure 3 demonstrates that this initial model scenario accurately represents the canopy data, and Figure 4 depicts kidney bean yield results based on model simulations with constant irrigation for a range of hydraulic conductivity values that characterize soil types in the upper Midwest. There is an optimal irrigation amount for each value of \(K_{\textrm{sat}}\); anything beyond this amount would constitute an inefficient use of water.
These results largely agree with advice and phenomenological conclusions from agronomists; they also provide a mechanistic intuition and novel ideas for future experiments to refine the model. Ultimately, the outcome of this study has inspired discussions with faculty from other disciplines about the creation of new soil sensors, drone sampling techniques, and image analysis to improve data collection. Better data leads to better models — a continuous cycle that benefits farmers and consumers.
Tyler Skorczewski delivered a contributed talk on this research at the 10th International Congress on Industrial and Applied Mathematics (ICIAM 2023), which took place in Tokyo, Japan, in August 2023. He received funding to attend ICIAM 2023 through a SIAM Travel Award that was supported by U.S. National Science Foundation grant DMS-2233032. To learn more about SIAM Travel Awards and submit an application, visit the online page.
References
[1] Allen, R.G., Pereira, L.S., Raes, D., & Smith, M. (1998). Crop evapotranspiration – Guidelines for computing crop water requirements (FAO Irrigation and Drainage Paper 56). Rome, Italy: Food and Agriculture Organization of the United Nations.
[2] Pelak, N., Revelli, R., & Porporato, A. (2017). A dynamical systems framework for crop models: Toward optimal fertilization and irrigation strategies under climatic variability. Ecol. Model., 365, 80-92.
[3] Walker, G.K., & Hatfield, J.L. (1979). Test of the stress-degree-day concept using multiple planting dates of red kidney beans. Agron. J., 71(6), 967-971.
About the Authors
Tyler Skorczewski
Associate professor, University of Wisconsin-Stout
Tyler Skorczewski is an associate professor in the Department of Mathematics, Statistics, and Computer Science at the University of Wisconsin-Stout. He earned a Ph.D. in applied mathematics from the University of California, Davis. Skorczewski studies applied mathematics in relation to biology, industrial applications, and sports analytics.

Keith Wojciechowski
Professor, University of Wisconsin-Stout
Keith Wojciechowski is a professor in the Department of Mathematics, Statistics, and Computer Science at the University of Wisconsin-Stout. He earned a Ph.D. in applied mathematics from the University of Colorado Denver. Wojciechowski applies mathematics to agriculture, music, and signal processing.

Related Reading
Stay Up-to-Date with Email Alerts
Sign up for our monthly newsletter and emails about other topics of your choosing.
