Data in the Intensive Care Unit Can Advance Critical Healthcare
A common pathway for patients in the hospital generally begins with the transition from an ambulance to the emergency room, then potentially routes through an operating room before ending up in the intensive care unit (ICU). Patients remain in the ICU to receive critical care and supervision until they relocate to a less intensive hospital ward, if possible (see Figure 1). “The ICU has staggeringly high death rates,” Sulimon Sattari of Medical Informatics Corp said. The mortality rates in critical care units are the highest of any area of the hospital, ranging from 10 to 29 percent. Hospitals in the U.S. make more than four million admissions to the ICU each year, and about 500,000 of those patients die.
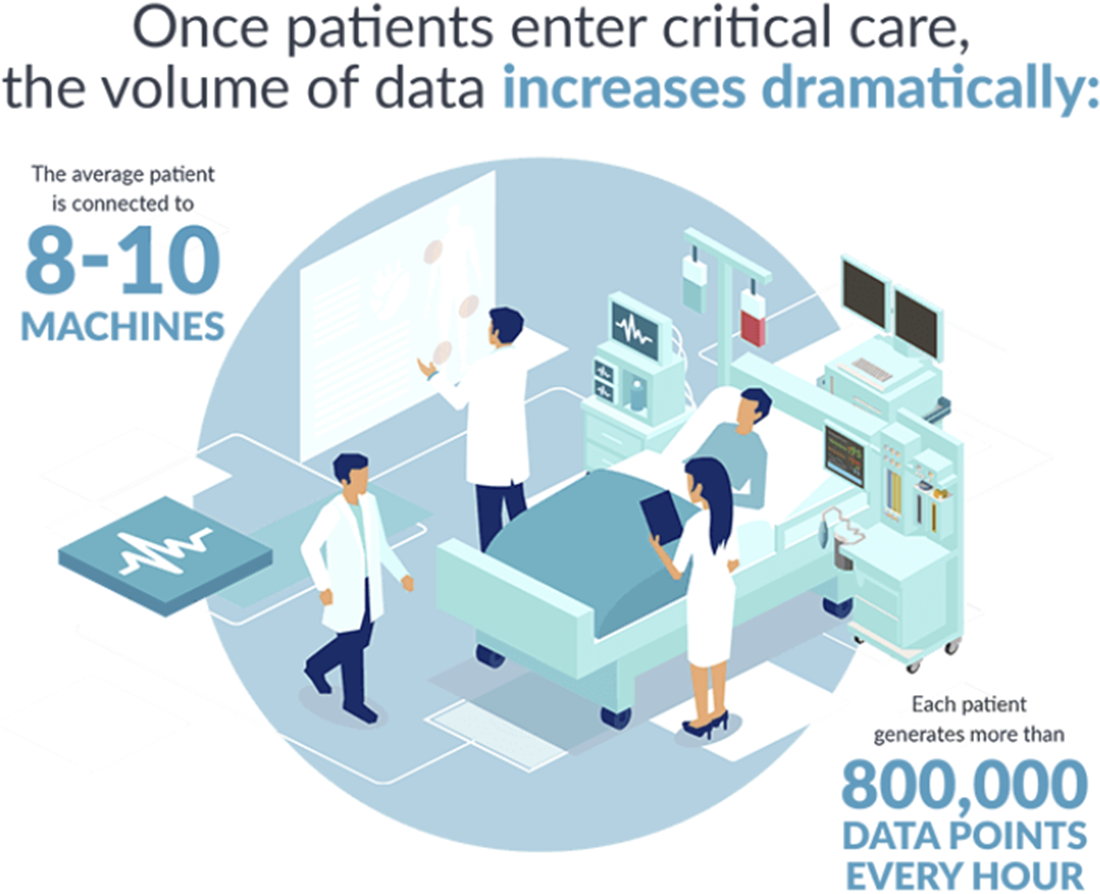
Patients in the ICU are closely monitored by clinicians as well as an average of eight to 10 medical machines, which leads to the generation of more than 800,000 data points every hour (see Figure 2). During a minisymposium presentation at the 2023 SIAM Conference on Applications of Dynamical Systems, which took place in Portland, Ore., this May, Sattari gave a broad picture of physiological time series data in the ICU and provided examples of recent research on mathematical tools that can extract key information from this data and enable lifesaving advances in critical care settings.

A wide variety of instruments provide useful ICU data. For instance, an electrocardiogram tracks the heart’s electrical signals, while gas monitoring via a finger pulse oximeter measures oxygen saturation levels in the blood. Blood pressure monitors or a catheter placed inside an artery provide hemodynamic information, and ventilators provide important data based on the gas monitoring of inhalations and exhalations, the respiratory waveform, and simply the settings on the ventilator itself. Furthermore, clinicians generate data in the course of their operations through lab requests and results, medication prescriptions, diagnoses, and admission and discharge notes.
All of these various forms of data that are produced for a single patient can potentially be translated into usable measurements. Hospitals are increasingly employing data science to sort through this overwhelming amount of data and produce insights for researchers and medical practitioners. “This is a general idea of what we’re doing with ICU data: in addition to looking at the patient, a clinician can also look at the suite of clinical tools,” Sattari said.

Sattari emphasized the relationship between domain expertise, modeling from data, and knowledge based on first principles. Machine learning tools that utilize clinical data can encounter issues such as bias and lack of generalizability, so the incorporation of clinician experience and a solid mathematical understanding is essential.
Sattari then named numerous examples of efforts that use dynamical systems tools with physiological time series data to hopefully improve healthcare outcomes. Additional speakers addressed many of these areas in further detail during the two-part minisymposium session on “Physiologic Timeseries Analysis and Modeling in Critical Care” in which Sattari presented. He provided an example of the blood pressure variability that can be visible in an arterial blood pressure waveform, and mentioned that machine learning tools can use Lorenz-type attractors with blood pressure data to detect some forms of arrhythmia. Control theory is important in the context of cerebral autoregulation, while calorimetry relates to the entropy production of the body. Furthermore, recent research in pulse oximetry has been addressing the bias that can arise in machine learning algorithms.
Overall, researchers are developing a multitude of exciting and interesting tools to utilize time series data in the ICU, but work remains to transform many of these ideas from mathematical dynamical systems into actual clinical applications. “If you check the literature, there is a lot of work on algorithms coming out, but much fewer that are actually implemented in clinical settings,” Sattari said. He and his colleagues are continuing to address this disconnect between the domains of research and implementation.
About the Author
Jillian Kunze
Master's student, Drexel University
Jillian Kunze is the former associate editor of SIAM News. She is currently a master’s student in data science at Drexel University.

Stay Up-to-Date with Email Alerts
Sign up for our monthly newsletter and emails about other topics of your choosing.


