Deducing the Physics That Underlie Extreme Weather
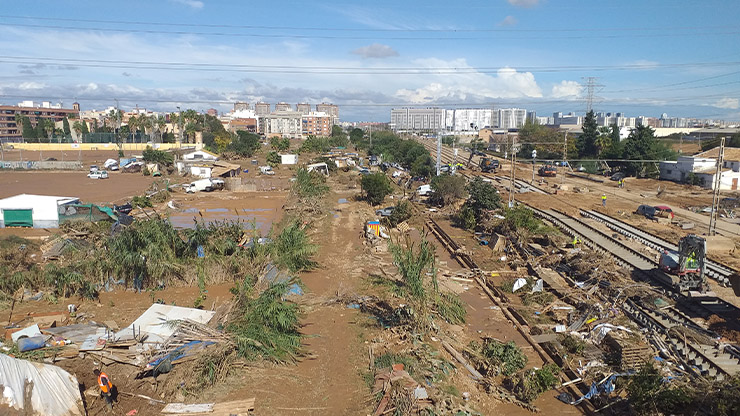
As the impacts of climate change continue to escalate, all regions of the globe are experiencing an uptick in extreme weather events: prolonged droughts, severe hot and cold spells, recurrent hurricanes (see Figure 1), and violent thunderstorms with attendant tornadoes. The scale and frequency of these occurrences defy our practices of language — not because thunderstorms, droughts, or hurricanes are unprecedented, but because we have no historical record of past incidents whose magnitudes and frequencies compare to present-day threats. The new normal is no normal.

Given the severity of such events, climate researchers and applied mathematicians have developed tools to better understand the statistics of weather extremes, provide probabilities, and predict their frequency. However, these methods do not typically address the underlying physical drivers of severe episodes, i.e., the specific climate-driven atmospheric conditions that make them possible. Recognizing this deficiency, an array of climate scientists, physicists, mathematicians, meteorologists, and other researchers have compiled a suite of mathematical techniques to address the gap. These experts use dynamical systems theory, climate models, and statistical physics to calculate the probability of extreme events directly from geophysical principles and meteorological data, ultimately improving the science of climate attribution.
“Climate and geophysical extremes are very complex,” climate researcher Gabriele Messori of Uppsala University in Sweden said. “They are naturally rare, and that poses data challenges. They are [also] associated with dynamics on a very broad range of scales, and they often result from multiple drivers.”
As Messori and his coauthors noted in their 2024 review paper [2], conventional statistical approaches to rare events cannot effectively handle spatial inhomogeneity—i.e., strong differences in conditions from place to place—or storms that arise from underlying conditions that have not previously occurred in recorded history. “Rather than [ask] questions like ‘How rare is this or how often would it occur?’, we could ask, ‘Given its extremity, is the physics behind this event unusual, or is it a typical physical pathway to something that is this extreme?’” Messori said. “We are not really doing modeling in the sense of modeling the climate. We are more developing tools to interpret data [that] can come from climate models, observations, or climate models constrained by observation. It can be any sort of data.”
Fluctuations in Space and Time
Weather models are a classic example of chaotic systems, as exemplified in meteorologist Edward Lorenz’s famous 1963 paper [3]. Small tweaks to initial conditions—including approximations in numerical simulations—can yield drastically different outcomes given enough runtime. The developers of data-informed simulations tend to utilize stochastic dynamical systems, whose equations incorporate nondeterministic factors (much like statistical physics) to account for the lack of precise knowledge of all relevant variables. Additionally, atmospheric models cannot neglect turbulence (see Figure 2), which involves self-similar vortices on a wide range of length scales and is not treatable with ordinary dynamical modeling; in fact, turbulence is still a major unsolved problem in physics.
Even without human activity, weather is a nonequilibrium system with a fluctuating energy input from the sun that is coupled with various sinks and dissipation mechanisms. As a result, the effective randomness in atmospheric conditions follows a non-Gaussian distribution, where extreme events occur as fluctuations at the far end of the probability tail.
One relevant approach models the velocity field in a fluid as \(u(t)=\langle u \rangle+\sum\limits_{l} \delta u_l(t)\), where the field consists of a mean value with time-dependent fluctuations \(\delta u_l(t)\) on each scale \(l\). Though this field is written in one dimension, it is easily generalizable to higher dimensions [2]. The specific manifestation of the fluctuations can include various forms of turbulence, such as the intermittent effects that are present in real-world phenomena. Multifractal analysis can help to describe this behavior. Rather than a fixed number, the fractal dimension is a continuous function called the singularity spectrum: \(\Big\langle \delta u {q \atop l} \Big\rangle \propto l^{\zeta(q)}\) for \(q \in \mathbb{R}\). Here, \(\zeta(q)\) is a function that characterizes the possible scaling factors from the Navier-Stokes equations in fluid dynamics.
Making Scientific Analogies
A lack of data frequently complicates the attribution of specific weather events to climate change, as such extremes have either never occurred in recorded history or only began occurring recently. Messori and his colleagues cited the massive deadly heat waves in Europe in 2003 and western North America in 2021 as examples of unprecedented historical events that enter the record, providing information about the conditions that allow them to gradually become part of recent history.

“Would the same weather conditions still give as strong a heat wave in a 1.6° colder climate?” Messori asked, referencing a new Copernicus Climate Change Service report that identified a 1.6° Celsius average increase in global temperature in 2024 compared to pre-industrial conditions [1]. “If not, then we can say that based on our analog analysis, this heat wave was \(X\) degrees warmer than it would otherwise have been without global warming.”
The particular example of heat waves is especially important given their deadliness, association with wildfire risk, and heightened stress on infrastructure like roads and railroad tracks. However, French meteorologists Pascal Yiou of the Laboratoire des Sciences du Climat et de l’Environnement and Aglaé Jézéquel of the Laboratoire de Météorologie Dynamique previously noted that many standard climate models only include summers that align with global trends, rather than exceptionally hot seasons [4]. Yiou and Jézéquel thus simulated heat waves that might occur once every 1,000 years under current conditions, aiming to understand the specific atmospheric physics that drive such incidents.
The analog method allows scientists to investigate the sufficiency of existing data or models—based on known extreme episodes—to predict events that have not yet occurred. Researchers can identify the conditions that give rise to extreme weather within a climate model, then rerun the model with perturbations around those conditions — thereby producing phenomena that the model might not otherwise predict.
The heart of Yiou and Jézéquel’s analog model is a stochastic weather generator, which the duo tested by simulating heat waves in France. The measurable quantity was the average temperature over a 15-day period, which was the output of a Markov chain generator; atmospheric circulation—such as anticyclonic action—provided the transition probabilities. Since this circulation is not directly observable, one can use analogs of unavailable data that do or do not incorporate knowledge of specific heat waves to tweak the probabilities. “Are there many ways in which the atmosphere can get into the particular state that created this extreme weather?” Messori asked. “Or are there very few ways to reach that state? Did the persistence of the system play a role in engendering the extreme event?”
Don’t Know Why There’s No Sun up in the Sky
Many existing methods that evaluate extreme events were initially developed for other scientific fields, including astrophysics and theoretical fluid dynamics [2]. In fact, the overall methodology encompasses other rare geophysical incidents — such as geomagnetic storms due to solar activity, which are obviously not under human control but can still dramatically impact society. Messori and his collaborators even reference the Lorenz “butterfly” attractor, which was originally formulated as an idealized weather model but nonetheless serves as a toy framework for the physical underpinnings of rare extreme events.
However, the underlying complexity of the climate and other geophysical systems means that even sophisticated, cutting-edge methods require continued refinement. “A number of the approaches that we present assume a stationary or quasi-stationary system, so several of them are not designed to say something about rapid changes,” Messori said. “As long as you have a slow drift, they’ll still do their job.”
Nevertheless, Messori was quick to note that these approaches are neither toys nor abstract theory. “We’re not developing tools for the sake of developing tools,” he said. “The idea is to probe a complex, chaotic system, such as the Earth.”
References
[1] European Commission. (2025). The 2024 annual climate summary: Global climate highlights 2024. Retrieved from https://www.preventionweb.net/publication/2024-annual-climate-summary-global-climate-highlights-2024.
[2] Faranda, D., Messori, G., Alberti, T., Alvarez-Castro, C., Caby, T., Cavicchia, L., … Wormell, C. (2024). Statistical physics and dynamical systems perspectives on geophysical extreme events. Phys. Rev. E, 110(4), 041001.
[3] Lorenz, E.N. (1963). Deterministic nonperiodic flow. J. Atmos. Sci., 20(2), 130-141.
[4] Yiou, P., & Jézéquel, A. (2020). Simulation of extreme heat waves with empirical importance sampling. Geosci. Model Dev., 13(2), 763-781.
About the Author
Matthew R. Francis
Science writer
Matthew R. Francis is a physicist, science writer, public speaker, educator, and frequent wearer of jaunty hats. His website is https://bowlerhatscience.org.
Related Reading
Stay Up-to-Date with Email Alerts
Sign up for our monthly newsletter and emails about other topics of your choosing.


