
Mathematical Framework Explains Evolutionary Dynamics of Behavior
If a ninespine stickleback fish could choose between a diet that was rich or poor in nutrients, what would it pick? A 2010 study found that these fish tend to copy each other when choosing a meal, opting for the feeder at which other fish have already foraged [3]. A 2018 mating experiment with fruit flies revealed similar social behavior [1]. The male flies were artificially colored pink or green, and a set of female flies watched other females choose their male partners; the females tended to prefer the same males that were previously selected, even if the colors were reversed. Such behavior, known as conformity, is defined as the tendency to copy the majority opinion.
Humans exhibit conformity as well. Our numerous decisions throughout the day—such as what and how much food to eat, when to go to bed, and whether to purchase a particular product—often reflect the behavior of the majority. “Let’s say that you want to choose between two restaurants, and you notice that more people are going to one of them,” Kaleda Denton, an evolutionary biologist at the Santa Fe Institute, said. “You might think that’s a better restaurant, even if the other one has equally good reviews.”
The opposing behavior, called anti-conformity, involves going against popular conduct — such as picking a unique baby name to stand out. “These processes balance the need for stability and adaptability within populations,” Aviv Bergman, a professor at the Albert Einstein College of Medicine, said.
Previous mathematical models of conformity have often focused on discrete decisions (e.g., choosing between two feeders or several products), wherein the most popular decision is simply the most common one. In the case of continuous decisions (e.g., selecting a level of behavior on a spectrum), conformity is sometimes defined as a preference for the population’s “mean” behavior. This approach works well if popular traits indeed reflect the mean, such as working hours or food portion sizes. However, the mean may not correctly indicate popularity in scenarios where beliefs are polarized to either end of a spectrum. For example, if half of a population holds political views on the far left and half prefers the far right, the mean is in the center — which does not correspond to any popular view. So, how can we surpass the simple conclusion that the mean is the most popular?
Denton and her colleagues Elisa Heinrich Mora, Michael Palmer, and Marcus Feldman of Stanford University address this open question in a recent study [2]. Building upon existing models, they present an enhanced mathematical framework that enables a nuanced exploration of the spread of cultural phenomena—like traits and beliefs—within a population. Unlike earlier models that assume discrete traits (i.e., variants), the new model incorporates a continuous range of traits.
Rather than define conformity as a preference for the mean cultural variant, the researchers view it as a preference for cultural variants that are most similar to each other (i.e., cluster together). “[This] work actively redefines how individuals interpret and respond to social information,” Bergman, who was not associated with the study, said.
The collaborators consider a population of \(N\) individuals, each of whom possesses a cultural variant that is represented by a value from \(0\) to \(1\). Members of this population reproduce and generate a total of \(N\) offspring who each independently acquire a cultural variant under certain assumptions. First, every offspring randomly samples \(n\) role models from the previous generation. The offspring use these role models to create a probability distribution based on their levels of conformity, anti-conformity, or a neutral type of decision-making; this customized probability distribution then allows each offspring to adopt its own cultural variant. As the offspring become the new adult population in each generation, the steps repeat.
Given a sample of \(n\) role models, \(\boldsymbol{x}=(x_1,x_2,x_3,...x_n)\) is the range of all sampled variants. If \(x_i\) is one such variant, it will have a probability of
\[P_k(x_i|\boldsymbol{x})=\frac{1}{n}+\frac{g_{i,k}(\boldsymbol{x})d_k(\boldsymbol{x})}{n}.\tag1\]
Here, \(d_k(\boldsymbol{x})\) is a constant for a given role model sample \(\boldsymbol{x}\), \(k\) is a parameter that calculates variants’ distances from each other, and \(g\) captures the popularity of \(x_i\). If \(x_i\) is popular, then it is more densely clustered near other variants than average and \(g_{i,k}(\boldsymbol{x})\) is positive. If \(x_i\) is unpopular, it is further from the other variants than average and \(g_{i,k}(\boldsymbol{x})\) is negative.
![<strong>Figure 1.</strong> Probability density that an individual will adopt a continuous cultural variant based on a role model sample, with \(k=2\) and either conformity \((d_k(\boldsymbol{x})=0.9\) for <strong>1a</strong> and <strong>1b</strong>) or anti-conformity (\(d_k(\boldsymbol{x})=-0.9\) for <strong>1c</strong> and <strong>1d</strong>). The black triangles and dashed lines indicate the sample of \(n=6\) role models with variants \(\boldsymbol{x}= (0.1, 0.15, 0.25, 0.6, 0.7, 0.9)\). Given this sample, the curves show the probability density for a single individual to adopt a variant; \(\sigma=0.1\) for <strong>1a</strong> and <strong>1c</strong> and \(\sigma=0.05\) for <strong>1b</strong> and <strong>1d</strong>. Traits that are clustered together more closely have a higher probability of selection with conformity and a lower probability with anti-conformity. Figure adapted from [2].](/media/t2yh5kjl/figure1_alt.jpg)
When conformity is present, \(d_k(\boldsymbol{x})\) is positive. If \(g_{i,k}(\boldsymbol{x})\) is also positive, then the probability of trait adoption is greater than \(\frac{1}{n}\), i.e., \(P_k(x_i|\boldsymbol{x})>\frac{1}{n}\). For anti-conformity, \(d_k(\boldsymbol{x})\) is negative and the reverse should be true, such that \(P_k(x_i|\boldsymbol{x})<\frac{1}{n}\) if \(x_i\) is popular. The more densely clustered (popular) variants should thus be adopted with a probability that is smaller than \(\frac{1}{n}\), as anti-conformists do not amplify popular variants (see Figure 1).
In the instance of random copying—when neither conformity nor anti-conformity is present—the conformity coefficient \(d_k(\boldsymbol{x})=0\). Here, \(P_k(x_i|\boldsymbol{x})=\frac{1}{n}\), implying that each of the \(n\) randomly sampled role models’ cultural variants is selected with an equal probability of \(\frac{1}{n}\).
Once an individual chooses a cultural variant \(x_i\) from their sample of role models based on the probability in \((1)\), \(x_i\) becomes the mean of a normal distribution with standard deviation \(\sigma\). This parameter \(\sigma\) introduces error into the model; if \(\sigma\) is not zero, then one may not copy the exact value of \(x_i\).
To measure a variant’s popularity, the researchers introduce a metric called \(k\)-dispersal that considers a variant’s distance to its \(k\) closest neighbors. For example, imagine the hair length in inches of five different people: \(\boldsymbol{x}=(5, 12, 12.5, 13, 20)\). The first and last variants of \(5\) and \(20\) inches are more dispersed from the other variants compared to the three middle values.
Consider a function \(f_{i,k}(\boldsymbol{x})\), where \(f\) measures a given variant’s distance from the rest of the sample. A variant’s \(k\)-dispersal is denoted by \(f_{i,k}(\boldsymbol{x})\), and the average \(k\)-dispersal of all variants in the sample of \(n\) role models is \(\bar{f}_k(\boldsymbol{x})=\sum^n_{i=1}f_{i,k}(\boldsymbol{x})/n\). Then, the value of \(g_{i,k}(\boldsymbol{x})\) is positive and variant \(x_i\) is popular if it is less dispersed than average—that is, \(f_{i,k}(\boldsymbol{x})<\bar{f}_k(\boldsymbol{x})\)—and vice versa.
The below equation captures positive \(g\):
\[g_{i,k}(\boldsymbol{x})=\frac{[f_{i,k}(\boldsymbol{x})]}{\Sigma_{z\in \textrm{II}}z^{-1}}^{-1} \enspace \textrm{if} \enspace f_{j,k}(\boldsymbol{x})>0 \forall j \enspace \textrm{and} \enspace f_{i,k}(\boldsymbol{x})\in \textrm{II}, \;\; \textrm{II}=\{z:0<z<\bar{f}_k(\boldsymbol{x})\}. \tag2\]
\(\textrm{Group II}=\{z:0<z<\bar{f}_k(\boldsymbol{x})\}\) consists of dispersal values \(f_{j,k}(\boldsymbol{x})\) in \(\boldsymbol{x}\) that are lower than average but not zero. Here, \(x_i\) is closer to others (and thus more popular) than the average dispersion of variants. If we plug \((2)\)—i.e., a positive value of \(g\)—into \((1)\) along with conformity (i.e., \(d_k(\boldsymbol{x})>0\)), the probability of adopting the cultural variant is higher than the baseline probability of \(\frac{1}{n}\).
If the reverse is true and the dispersal value \(f_{i,k}(\boldsymbol{x})\) for \(x_i\) is higher than the average dispersal, then this quantity is captured in \(\textrm{Group I}=\{z:z>\bar{f}_k(\boldsymbol{x})\}\). In this scenario, \(g\) is negative:
\[g_{i,k}(\boldsymbol{x})=-\frac{f_{i,k}(\boldsymbol{x})}{\Sigma_{z\in \textrm{I}}z} \enspace \textrm{if} \enspace f_{i,k}(\boldsymbol{x})\in \textrm{I}, \;\; \textrm{I}=\{z:z>\bar{f}_k(\boldsymbol{x})\}. \tag3\]
When \(d_k(\boldsymbol{x})>0\) and we insert negative \(g\) from \((3)\) into \((1)\), it produces a probability value that is less than \(\frac{1}{n}\). Despite the presence of conformity, the variant is not popular and hence will not be amplified. As an example, \((2)\) does not hold if some cultural variants in the sample are identical (i.e., \(f_{i,k}(\boldsymbol{x})=0\)). And if \(m\) cultural variants have \(k\)-dispersals of zero in this instance, then they each have the same \(g\) value of \(1/m\).
When a trait’s dispersal exactly equals the average dispersal, there is no basis as to whether it should be amplified. As a result, \(g\) becomes zero:
\[g_{i,k}(\boldsymbol{x})=0 \enspace \textrm{if} \enspace f_{i,k}(\boldsymbol{x})=\bar{f}_k(\boldsymbol{x}). \tag4\]
Plugging \((4)\) into \((1)\) yields a probability of adopting that view of just \(\frac{1}{n}\).
“This work opens new paths for empirical research on real-world populations and sets the stage for more sophisticated models of collective behavior, cultural change, and adaptation,” Bergman said.
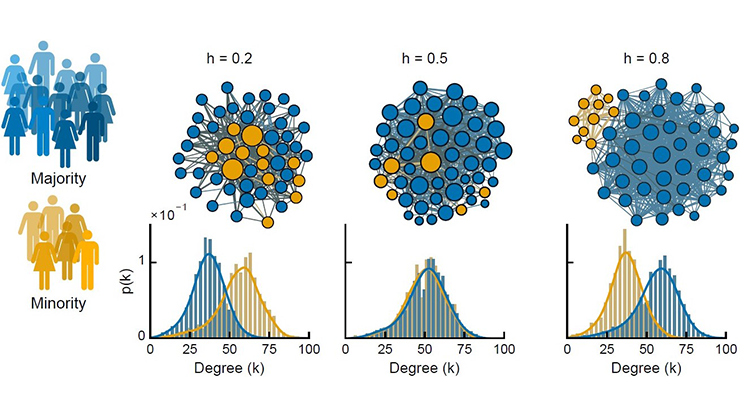
![<strong>Figure 2.</strong> The effect of conformity and standard deviation on the trait distribution of the simulated population after 100 generations. Figure courtesy of [2].](/media/o3sjwjzy/figure2.jpg)
While these equations describe an individual’s adoption of a cultural variant, numerical simulations provide insights for a scaled population model. Figure 2 depicts trait distributions in a population of 10,000 individuals—each of whom selects traits from their own sample—that is simulated over 100 generations.
Given high conformity (top two rows of Figure 2) and relatively low \(\sigma\), the population distributions seem to peak around the center of the trait distribution. This outcome implies that conformity sometimes incentivizes individuals to become more similar to the population mean, with lower population-level variance. As expected, increasing \(\sigma\) (left to right in any row of Figure 2) has a smoothing effect on distributions, whose peaks may fall to the left or right of the center.
Surprisingly, this study found that conformity does not necessarily lead to a homogenous population. While prior models identified a conformist’s ideal trait value as the mean trait value in a population, Denton et al.’s model instead focuses on variant popularity. This new framework allows the researchers to define conformity as a disproportionate tendency to adopt a more clustered cultural variant (as opposed to the mean), and anti-conformity as the opposite tendency. For instance, Figure 2 illustrates a range of different cultural variant distributions, from narrow to broad. Unexpectedly, the group also found that high levels of anti-conformity cause a buildup of trait values near the edges, constituting high polarization. “This link between [conformity and homogeneity] is more nuanced than we thought,” Denton said. “It depends on how you define the parameters in the model.”
In the future, one could expand this model to incorporate personal beliefs. Extending the theoretical results to real-life population datasets could also yield further insights into the evolutionary dynamics of biases.
References
[1] Danchin, E., Nöbel, S., Pocheville, A., Dagaeff, A.-C., Demay, L., Alphand, M., … Isabel, G. (2018). Cultural flies: Conformist social learning in fruit flies predicts long-lasting mate-choice traditions. Science, 362(6418), 1025-1030.
[2] Heinrich Mora, E., Denton, K.K., Palmer, M.E., & Feldman, M.W. (2025). Conformity to continuous and discrete ordered traits. Proc. Natl. Acad. Sci., 122(3), e2417078122.
[3] Pike, T.W., & Laland, K.N. (2010). Conformist learning in nine-spined sticklebacks’ foraging decisions. Biol. Lett., 6(4), 466-468.
About the Author
Lakshmi Chandrasekaran
Freelance science writer
Lakshmi Chandrasekaran holds a Ph.D. in mathematical sciences from the New Jersey Institute of Technology and a master’s degree in science journalism from Northwestern University. She is a freelance science writer whose work has appeared in MIT Technology Review, Quanta, Science News, and other outlets.

Related Reading
Stay Up-to-Date with Email Alerts
Sign up for our monthly newsletter and emails about other topics of your choosing.
