
Reflections on a Century of Traffic Modeling
In 1924, economist Frank Knight published a paper in the Quarterly Journal of Economics that discussed the interpretation of social cost [5]. One example in this paper probably comprises the first well-defined traffic model. Knight considered two locations that are connected by two different highways: one that is broad but poorly surfaced, and one that is narrow but better surfaced. Knight argued that driver preference for the narrower but higher quality road could lead to a nonoptimal use of roadways, which justified the introduction of tolls. His example formed the basis of John Glen Wardrop’s developments in the 1950s [11], as well as the definitions of user equilibrium and the price of anarchy (i.e., a system’s fall in efficiency due to selfish user behavior).
A word of care: Knight’s example may be the first traffic model, but traffic as a phenomenon appeared much earlier. In fact, the Romans built an efficient road system that included traffic signals. At the time of Julius Caesar, carriage traffic posed a problem in cities like Rome and Pompei, and special laws were enacted to limit negative impacts on the population.
In the 1930s, Bruce Greenshields performed a seminal experiment at the exit of the Lincoln Tunnel, which connects New York and New Jersey [3]. He used cameras to help compute the density and speed of cars, noticing that the speed decreases linearly with an increase in density. The formula that describes traffic flow is \(f=\rho \cdot v\), where \(f\) is the flow (i.e., the number of cars that cross a given point in a unit of time), \(\rho\) is the car density (i.e., the number of cars per unit of space), and \(v\) is the average or group speed of the cars. Greenshields’ measurements implied that \(v=v_\textrm{max}(1-\rho)\), where \(v_\textrm{max}\) is the maximal allowable speed. This effort served as the first instance of the combination of data and technology to construct mathematical models of traffic. The graph of the flow \(f\) as a function of density \(\rho\) is called the “fundamental diagram,” and Greenshields’ formulation is still in use today.
In the 1950s, Michael Lighthill and Gerald Whitham [7]—and independently, Paul Richards [8]—proposed the first partial differential equation (PDE) model for traffic: \(\rho_t+(\rho \; v(\rho))_x=0\), which is a conservation law for car density under the assumption that the average speed depends only on the density itself. This notation describes the macroscopic level of traffic; researchers have also proposed microscopic models with ordinary differential equations for each car. Macroscopic-level models are less accurate than microscopic models and rely on the continuum hypothesis, which is not physically satisfied by cars on a road. Nevertheless, macroscopic or fluid dynamic models are very effective in formulating and solving several traffic problems. One of the prevailing challenges is the nonlinearity of conservation laws, which gives rise to discontinuous solutions in finite time as traveling shocks. Scientists often use weak solutions in the space of bounded variation functions to develop the theory.
![<strong>Figure 1.</strong> Mathematical model for the Mobile Century experiment. Figure courtesy of [11].](/media/q1hkikr0/figure1.jpg)
Subsequent work in the 1990s and 2000s adapted conservation law models to the case of road networks [4]. Formally, a road network is a topological graph where edges represent roads and vertices represent junctions. On each edge, we can use a macroscopic model (e.g., the Lighthill-Whitham-Richards model). We must then define a dynamic at the vertices. Interestingly, the conservation of cars (or flows) through the junction alone does not determine a unique time evolution; additional criteria are necessary. Traffic distribution provides a natural evolution, and we can assume that the flow from incoming roads is distributed to outgoing ones based on a matrix of the traffic distribution coefficient. However, this assumption is still not enough to determine a unique dynamic; we must add rules such as maximization of the flow through the vertex, which serves as an entropy rule at the junction [2]. This line of research attracted the attention of many applied mathematicians because of its connections to other areas, including supply chains, water canals, data networks, and blood flow [1].
As an example of the application of macroscopic models, we will first focus on traffic monitoring. In 2008, the Mobile Century experiment used data from mobile phones to implement the first real-time traffic monitoring system (see Figure 1). This experiment paved the way for traffic monitoring with cellular data, influencing both the scientific field and the market. A new method utilized ensemble Kalman filtering to combine the numerical treatment of conservation laws on graphs with data from phones and sensors [12]. This technique successfully demonstrated the combination of advanced mathematical modeling and engineering control approaches; such traffic monitoring techniques were subsequently adopted by many industrial providers, such as Google, Waze, and Apple. A follow-up project called Mobile Millennium was launched in San Francisco on November 10, 2008, and demonstrated live in New York City eight days later at the 15th World Congress on Intelligent Transportation Systems.
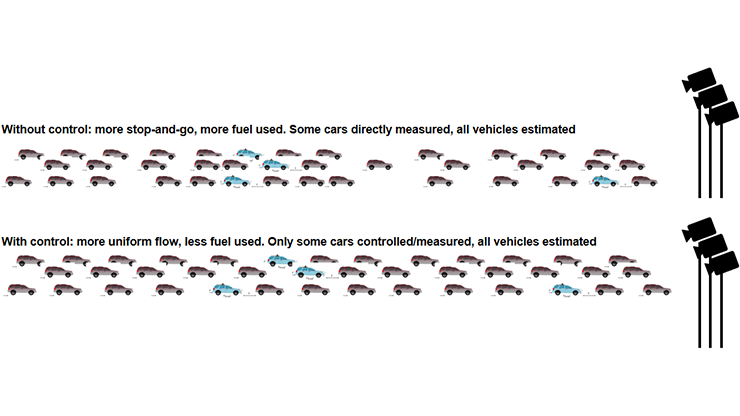
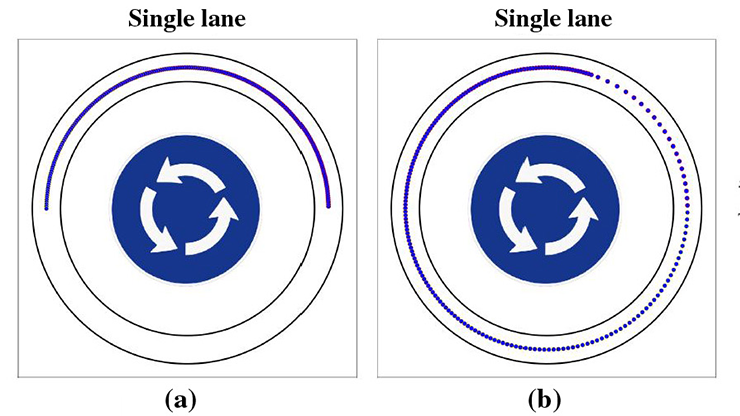
Moving on to traffic management, a 2006 seminal experiment led by Takemi Sugiyama reproduced stop-and-go waves on a ring road [10]. These waves are ubiquitous on highways and decrease fuel efficiency and safety. A decade later, researchers proved that a single AV with an appropriate control algorithm—implemented as a modification of the adaptive cruise control (ACC) setting on most upper-level cars—can dissipate stop-and-go waves in the ring road setting [9]. The results showed a 40 percent decrease in fuel consumption for all cars and a 98 percent decrease in heavy breaking, thus improving both the economic and safety aspects of traffic.
In 2022, researchers sought to examine stop-and-go waves in a highway setting through the deployment of the I-24 MOTION system, which consists of 300 high-resolution cameras that cover a four-mile stretch of Interstate 24 in Nashville, Tenn. It is the world’s largest system of this type, capable of processing more than 200 million miles of vehicle trajectories via camera clips and a multi-object vision tracking algorithm that generates high-resolution data. The dataset is 10,000 times larger than the celebrated Next Generation Simulation open dataset, which gave rise to 3,500 publications.

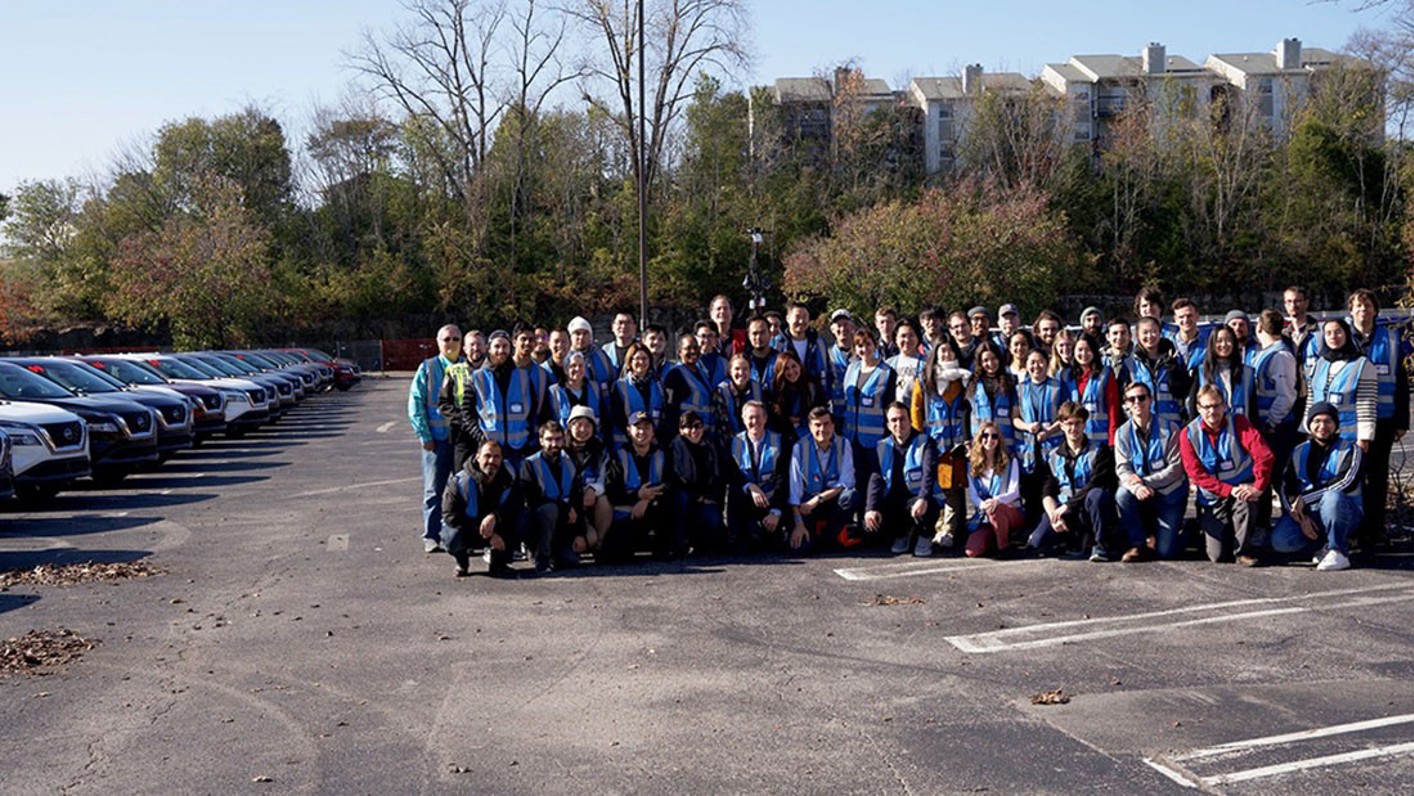
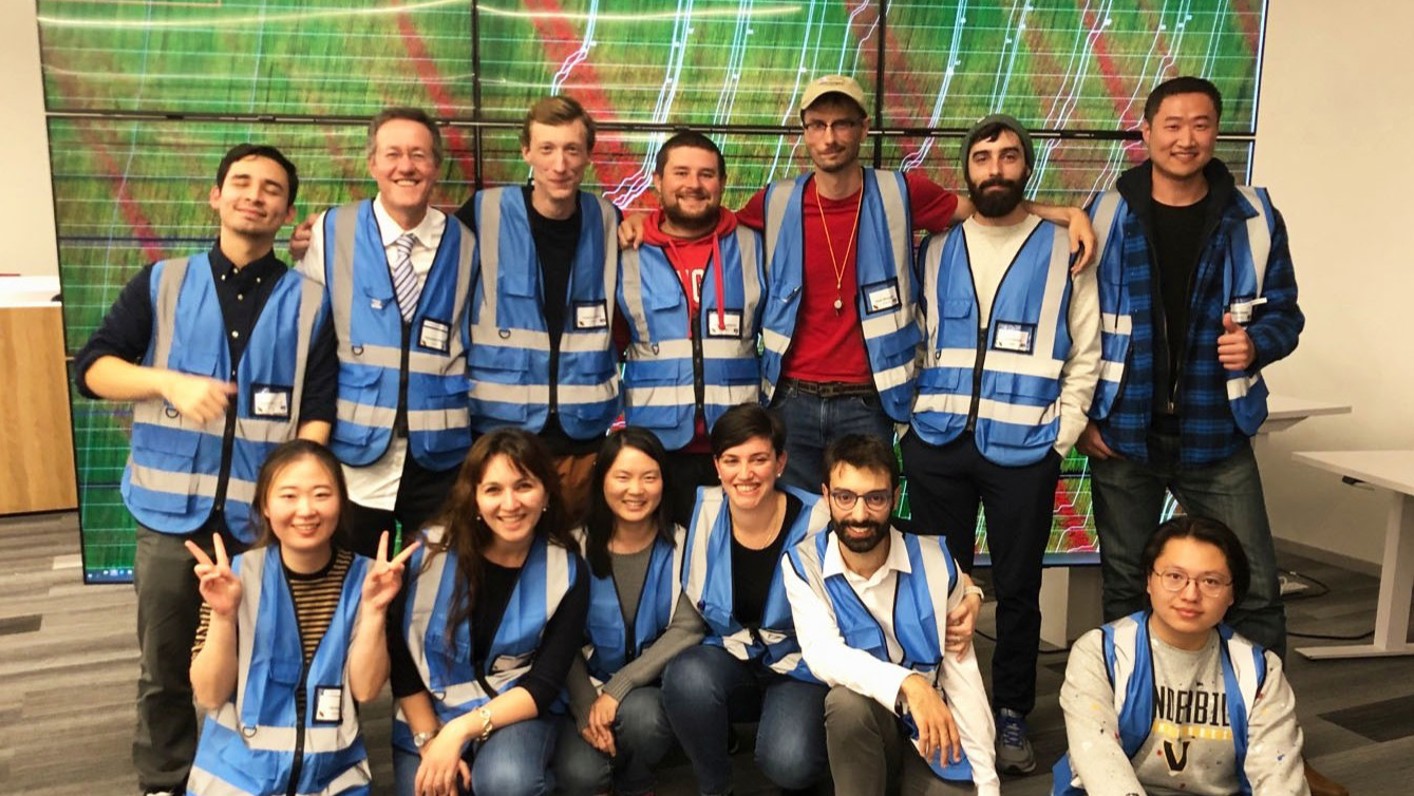
The CIRCLES Consortium (short for “Congestion Impacts Reduction via CAV-in-the-loop Lagrangian Energy Smoothing”) performed the largest experiment in traffic history in November 2022, using automated vehicles (AVs) on the open I-24 highway in Nashville to smooth stop-and-go waves. Nissan, Toyota, and General Motors provided more than 100 level-2 AVs for the project and collaborated with the four universities in CIRCLES—University of California, Berkeley; Rutgers University-Camden; Temple University; and Vanderbilt University—as well as the Tennessee Department of Transportation [6]. The experiment—which was executed across five consecutive days during morning rush hour—involved over 70 researchers and collaborators from the CIRCLES Consortium, more than 170 drivers who were trained every morning in safe driving and use of the control algorithms, and over 30 support staff.
After arriving at their assigned routes and lanes on I-24, drivers activated the control algorithms via the ACC button. These control algorithms comprised a combination of macroscopic traffic models, Lyapunov-type controls, artificial intelligence (AI), and engineering design. Highway traffic is simultaneously a cyber-physical system (with cars and infrastructure as the physical component, and cameras, onboard technology, and sensors as the cyber component) and a socioeconomic system (with drivers as humans in the loop, and fuel consumption and emissions as the economic component). Ultimately, this field experiment affirmed the feasibility of acting on large systems to improve the system-level performance and the human experience.
This article provides a brief roadmap of the history of vehicular traffic models. It is by no means exhaustive, as we focused on macroscopic models and PDEs in real-world applications. Technological advances like AI are ushering in a new era that allows for novel capabilities in the management and improvement of traffic systems. Moreover, we can exploit the highly complex nature of traffic for knowledge transfer to other important socioeconomic systems. The role of mathematical modeling will be increasingly important as such advances take place.
Benedetto Piccoli, recipient of the 2024 W.T. and Idalia Reid Prize, delivered a corresponding prize lecture on this topic at the 2024 SIAM Annual Meeting, which took place last year in Spokane, Wash.
References
[1] Bressan, A., Čanić, S., Garavello, M., Herty, M., & Piccoli, B. (2014). Flows on networks: Recent results and perspectives. EMS Surv. Math. Sci., 1(1), 47-111.
[2] Garavello, M., Han, K., & Piccoli, B. (2016). Models for vehicular traffic on networks. In AIMS on applied mathematics (Vol. 9). Springfield, MO: American Institute of Mathematical Sciences.
[3] Greenshields, B.D., Bibbins, J.R., Channing, W.S., & Miller, H.H. (1935). A study of traffic capacity. In Proceedings of the fourteenth annual meeting of the Highway Research Board (pp. 448-477). Washington, D.C.: Highway Research Board.
[4] Holden, H., & Risebro, N.H. (1995). A mathematical model of traffic flow on a network of unidirectional roads. SIAM J. Math. Anal., 26(4), 999-1017.
[5] Knight, F.H. (1924). Some fallacies in the interpretation of social cost. Q. J. Econ., 38(4), 582-606.
[6] Lee, J.W., Wang, H., Jang, K., Lichtlé, Hayat, A., Bunting, M., … Bayen, A.M. (2025). Traffic control via connected and automated vehicles (CAVs): An open-road field experiment with 100 CAVs. IEEE Control Syst., 45(1), 28-60.
[7] Lighthill, M.J., & Whitham, G.B. (1955). On kinematic waves II. A theory of traffic flow on long crowded roads. Proc. R. Soc. A, 229(1178), 317-345.
[8] Richards, P.I. (1956). Shock waves on the highway. Oper. Res., 4(1), 42-51.
[9] Stern, R.E., Cui, S., Monache, M.L.D., Bhadani, R., Bunting, M., Churchill, M., … Work, D.B. (2018). Dissipation of stop-and-go waves via control of autonomous vehicles: Field experiments. Transp. Res. C Emerg. Technol., 89, 205-221.
[10] Sugiyama, Y., Fukui, M., Kikuchi, M., Hasebe, K., Nakayama, A., Nishinari, K., ... Yukawa, S. (2008). Traffic jams without bottlenecks — experimental evidence for the physical mechanism of the formation of a jam. New J. Phys., 10, 033001.
[11] Wardrop, J.G. (1952). Road paper. Some theoretical aspects of road traffic research. Proc. Inst. Civ. Eng., 1(3), 325-362.
[12] Work, D.B., Blandin, S., Tossavainen, O.-P., Piccoli, B., & Bayen A.M. (2010). A traffic model for velocity data assimilation. Appl. Math. Res. eXpress, 2010(1), 1-35.
About the Author
Benedetto Piccoli
University Professor, Rutgers University–Camden
Benedetto Piccoli is University Professor and the Joseph and Loretta Lopez Chair Professor of Mathematics at Rutgers University–Camden, where he previously served as Vice Chancellor for Research. His research interests span various areas of applied mathematics, including control theory; traffic flow on networks; crowd dynamics; mathematical finance; and applications to autonomous driving, population health, and biomedical systems. Piccoli is the recipient of the 2009 Fubini Prize, the 2024 SIAM W.T. and Idalia Reid Prize, and the 2024 IEEE ITS Institutional Lead Award. He is an inaugural 2013 fellow of the American Mathematical Society.
Related Reading
Stay Up-to-Date with Email Alerts
Sign up for our monthly newsletter and emails about other topics of your choosing.
