
The Physics of Surfaces: Why City Growth is So Rough
Cities are extraordinarily complex systems. Some of the fastest-growing urban centers, many of which are in Asia and Africa, involve an intricate combination of social, economic, geographical, topographical, and political factors to understand their structures. City expansion also places unprecedented stress on the environment, necessitating new ways of thinking about land and resource management. Collectively, these complications make any sort of city modeling a daunting endeavor.
Nevertheless, mathematically minded researchers routinely rise to the challenge. A recent effort draws on the physics of surfaces, which studies the organization of atoms and molecules on a substrate according to the properties of both the added particles and the surface on which they land. This work attempts to find new ways to model city growth that are as independent as possible from the particular socioeconomic and geographic details that make each city unique.
“Most of the studies so far considered the growth of a one-dimensional (1D) surface, so the [city] grows in just one direction,” Marc Barthelemy, a theoretical physicist at the Institut de Physique Théorique in France, said. In other words, many existing mathematical models and simulations for city expansion are based on bacterial growth and assume a rotationally symmetric city. In contrast, a surface physics-based approach allowed Barthelemy and his collaborators to include spatial irregularities in structure. “A city is also extremely anisotropic,” he said. “You cannot look at a city, take a central point, and say on average that its shape will be a circle.”
By moving beyond the 1D model, the team applied well-established techniques from surfaces. In a recent paper [2], they extracted several universal properties from urban data, including the local “roughness” of a city boundary. “To my knowledge, it is the first paper that tries this sort of measure of growing surfaces on cities,” Barthelemy said, explaining that the work appeals to his background in statistical physics. The group also determined that real-world cities don’t correspond to established universality classes from surface growth models — a realization that stands in strong disagreement with 1D approaches.
What is a City, Anyway?
From a social-scientific viewpoint, residential, commercial, industrial, and recreational factors—such as total population, roads, and land use—often take precedence over the shape and physical extent of a city. However, these factors are not independent of any pure size-and-shape considerations. For example, a 2020 study based on Landsat data estimated nearly 10,000 square kilometers of urban growth per year between 1985 and 2015 [1], with increased impacts on resources and the environment.
Even so, actually measuring the physical size and growth of cities is difficult. High-resolution spatial data for many parts of the world have only been available since the advent of Landsat and other Earth-observation survey satellites in the 1970s — a relatively short time window in which to measure change, particularly acceleration in growth rates.
Additionally, researchers must define a “city” in a strictly quantitative (rather than political) sense. A major U.S. urban area, for instance, may consist of a city core, suburbs, exurbs, and unincorporated zones that extend past various divisions for taxation or government purposes; from a geometrical measurement point of view, however, they all comprise one unit. For example, the aforementioned 2020 study used surface reflectance to measure city extent, which is different for settled areas versus undeveloped land, farms, or even smaller communities [1].
For their analysis, Barthelemy and his collaborators employed a city clustering algorithm from percolation theory [3] to identify the largest connected clump of any city in their datasets. They excluded growth that stemmed from the absorption of smaller population centers, which accounts for significant physical expansion of cities. Consider London, which has gradually expanded beyond its ancient boundaries over several centuries to encompass nearby towns like Kensington—now completely part of the city—as well as independent cities like Greenwich that are effectively continuous.
Thanks to government census-taking, city populations offer the best available data. To track physical growth, Barthelemy’s team hence turned to the World Settlement Footprint (WSF) Evolution dataset from Germany's Earth Observation Center. WSF Evolution utilizes Landsat satellites to map urban growth for the whole planet between 1985 and 2015, with the obvious caveats that these observations have significantly improved over the years and data is denser at higher latitudes because of Landsat’s orbital trajectory.
Dividing and Scaling
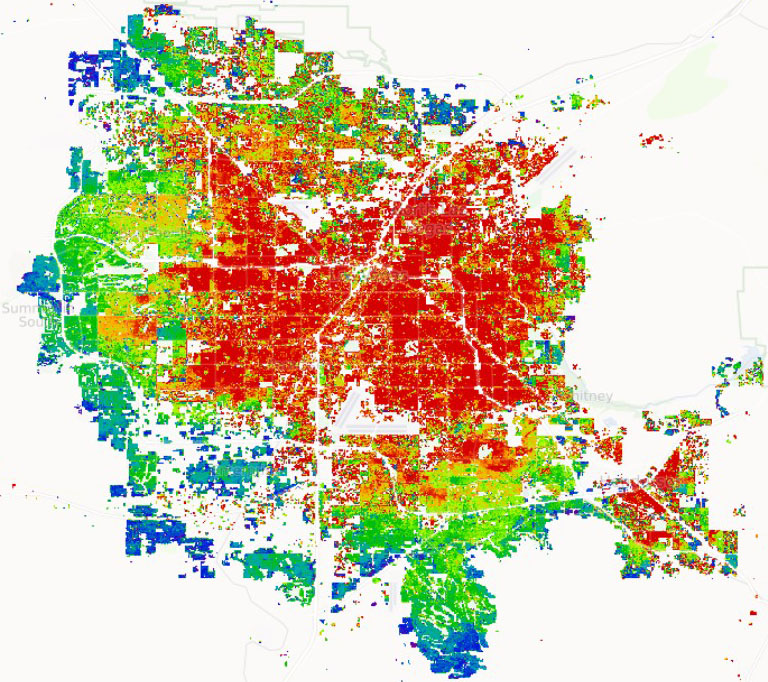
Based on the extensive WSF dataset, Barthelemy and his colleagues selected 19 cities that grew more or less radially outward without too many irregularities. They included Paris, France; Kolkata, India; Beijing, China; and Las Vegas, Nev. (see Figure 1)—which are expanding in a predominantly concentric manner—but not Los Angeles, Calif., whose growth is constrained by the Pacific Ocean on one side and mountains on the others. This self-imposed restriction allowed the researchers to address limited anisotropies but avoid the type of strongly directional growth that occurs due to mountains or water.
The team used the city clustering algorithm to identify the largest connected component (LCC), i.e., the city core. To measure growth and roughness, they divided each LCC into segments and calculated the average extent of the city from its geometrical center. Angular width is exactly the city size in a system with perfectly isotropic growth, but modeling expansion with rough—or even fractal—edges requires tinkering with the size of the segments. “If [segments] are too small, you are averaging over the size of two or three houses, for example,” Barthelemy said. “And [they can’t be] too large because then you average too much and you don’t see anything.”
The group settled on segment sizes of angular width \(\Delta\theta=2\pi/{\textit{N}}\), where \(N\approx50\) to keep each segment within those limits. Without a continuous time variable, they used population \(\textit{P}\) as a proxy time measure and defined the city “width”—effectively flattening two dimensions into one for comparison with other studies—via an estimate from anisotropic growth research:
\[w(\ell,P){\approx}{P^{\beta}}{\Bigg{(}\frac{\ell}{P^{1/z}}\Bigg{)}}^{\alpha_{\textrm{loc}}}.\]
Here, \(\ell=⟨r⟩\Delta\theta\) is the average arc length for each segment. The scaling exponents describe the rapidity at which roughness develops \((\beta)\); the rate at which roughness saturates \((z)\); and the local roughness coefficient \(\alpha_{\textrm{loc}}\), which is the key number in this study. Plotting city size against arc length for each population data point produces a curve that can estimate the exponents and (with some luck) reveal universal mathematical laws for city growth.
Unfortunately, luck is not always at hand. A 1D system only has one global roughness measure \(\alpha = {\beta}z\), and previous efforts identified distinct patterns in these numbers. However, Barthelemy’s team found \(\alpha_{\textrm{loc}}=0.776\pm0.475\) for the 19 cities in their sample. Additionally, \(\alpha\) ranged between \(0\) and \(2,\) where most values were larger than \(\alpha_{\textrm{loc}}\) and had no discernible pattern. In other words, local roughness appears to be a common factor between these diverse city samples, but global roughness and universality categories from 1D models do not match up with the data.
What Rough City
Since many of the cities in question have existed for centuries in some form—and most experienced rapid expansion well before 1985—any general conclusions are strictly provisional. “I wish I had remote sensing data over three or four centuries,” Barthelemy said with a laugh. Despite this limitation, he argues that the local roughness exponent is robust and reproducible; if new or better data become available, others can test the hypothesis.
“I trust the value of the exponent, which seems to characterize the geometry of the boundary in some sense,” Barthelemy said. “It’s unclear at what point [every city] could be described by one equation, but I think that if you add more cities, et cetera, it’ll just reinforce the message that we don’t have universality.” Simply put, city growth does not correspond to any existing universality classes, but there are still some quantitative properties that are available for extraction. The fact that the roughness exponent is the same for Las Vegas, Paris, and Changzhou, China—cities that could not be more different in most respects—indicates the presence of something that cannot be explained with 1D models.
References
[1] Liu, X., Huang, Y., Xu, X., Li, X., Li, X., Ciais, P., ... Zeng, Z. (2020). High-spatiotemporal-resolution mapping of global urban change from 1985 to 2015. Nat. Sustain., 3(7), 564-570.
[2] Marquis, U., Artime, O., Gallotti, R., & Barthelemy, M. (2025). Universal roughness and the dynamics of urban expansion. Phys. Rev. Lett., 135(18), 187403.
[3] Rozenfeld, H.D., Rybski, D., Andrade Jr., J.S., Batty, M., Stanley, H.E., & Makse, H.A. (2008). Laws of population growth. Proc. Natl. Acad. Sci., 105(48), 18702-18707.
About the Author
Matthew R. Francis
Science writer
Matthew R. Francis is a physicist, science writer, public speaker, educator, and frequent wearer of jaunty hats. His website is https://bowlerhatscience.org.
Related Reading

Stay Up-to-Date with Email Alerts
Sign up for our monthly newsletter and emails about other topics of your choosing.
