
The Renaissance of the Graph p-Laplacian in the Deep Learning Era: Unlocking Healthcare with Minimal Supervision
In the evolving landscape of artificial intelligence technology, deep learning has emerged as a transformative force that is propelling breakthroughs in fields like healthcare. However, the success of deep learning models hinges on the availability of large labeled datasets, and the process of obtaining annotations from domain experts is often expensive and time consuming. This challenge and subsequent bottleneck are particularly pronounced in healthcare settings, as expert annotations are scarce and patient data must be handled with utmost care.
Researchers have begun to explore unsupervised and semi-supervised learning techniques in their quest to unlock the full potential of explicit mathematical models and deep learning while minimizing reliance on labeled data. By harnessing the wealth of unlabeled data, models can learn more robust representations of the underlying data distribution and better generalize to unseen samples [5]. The use of unlabeled data is thus a compelling way to overcome the limitations of small labeled datasets, which makes semi-supervised learning an attractive approach for the healthcare domain.
The Quest for Hybrid Semi-supervised Models
A critical task in healthcare is diagnosis, which can be framed as a classification problem. This type of problem has garnered significant interest in the field of semi-supervised classification, which has the potential to reduce reliance on labeled data (see Figure 1). Several early works investigated novel objective functionals that aim to minimize a given energy in order to infer labels from a large amount of unlabeled data, leveraging a small labeled set as a prior [5, 10]. Other studies have analyzed graph-based approaches and employed techniques such as random walks, harmonic-based energies, graph min-cuts, and spectral methods. In recent years, deep semi-supervised techniques have also arisen as state-of-the-art performers that comprise two major families of methods: consistency regularization and pseudo-labeling.
![<strong>Figure 1.</strong> Workflow of a hybrid semi-supervised model that uses a tiny labeled dataset and large unlabeled dataset. First, we optimize over the tiny labeled set to extract meaningful features and construct a strong graph. We then utilize our proposed energy-based model in \((2)\) to generate pseudo-labels that are iteratively updated. The output is the confidence score per class and an attention map. Figure courtesy of [3].](/media/hwpc1fwr/figure1.jpg)
Another relatively new perspective centers on hybrid semi-supervised techniques that integrate explicit energy models with deep learning principles. Existing work in this area primarily focuses on improving network performance [7, 9], rather than exploring more robust energy models. We are currently developing enhanced energy functionals and investigating their impacts on the learning process, particularly for pseudo-labeling in deep learning [1-3]. Our approach differs from existing hybrid models and seeks to fuse energy models with deep neural networks to maintain theoretical guarantees while boosting performance.
Reviving the Graph \(p\)-Laplacian via Pseudo-labeling: A Hybrid Approach
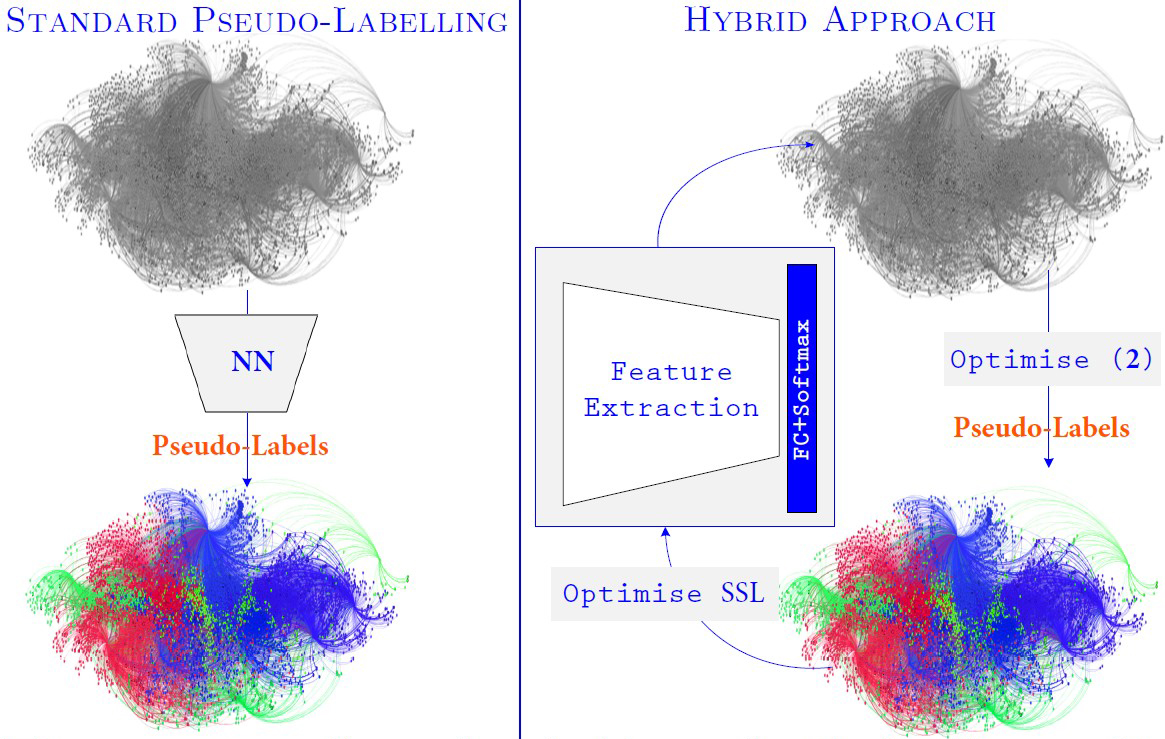
Hybrid models address the challenges of neural network calibration and confirmation bias in pseudo-labeling by ensuring that the predicted label probabilities align with the ground truth likelihood of correctness. Hybrid models consist of two components: an explicit energy functional and a deep network. We view the explicit functional as a promising approach that generates more meaningful pseudo-labels than those that are directly produced by a deep network. By iteratively refining pseudo-labels with energy optimization, the model can progressively enhance its predictions, measure uncertainty, and achieve higher performance in scenarios with limited labeled data. Figure 2 compares our hybrid perspective against the diffusion of minimal labels on a graph via standard pseudo-labeling.
Semi-supervised Classification: We begin with a small amount of labeled data \(\{(x_i,y_i)\}^l_{i=1}\) with provided labels \(\{y_i\}^l_{i=1} \in \mathcal{L}=\{1,...,L\}\) for \(L\) classes, and a large amount of unlabeled data \(X_U=\{x_i\}^n_{i=l+1}\). The whole dataset is thus \(X=X_L \cup X_U\), where \(X_L=\{x_1,...,x_l\}\). We wish to infer a function \(f:\mathcal{X} \mapsto \mathcal{L}\) such that \(f\) yields a good estimate for \(\{x_i\}^n_{i=l+1}\) with minimum generalization error; the function should also match the given labels for \(\{x_i\}^l_{i=1}\).
Graph Construction: We consider the feature extractor \(\varphi_\theta\) to be the bottleneck of a given network \(f_\theta\) that maps \(\mathcal{X}\rightarrow \mathbb{R}^P\) — i.e., maps the input to some feature vector of dimension \(P\). To construct our graph, we compute the set of descriptors for each sample as \(\mathbf{c_i}=\varphi_\theta(x_i)\in\mathbb{R}^P\) for \(x_i \in X\); connections are made via the k-nearest neighbors approach in \(\mathbb{R}^P\). Here, \(f_\theta\) and the feature extractor \(\varphi_\theta\) are updated based on the pseudo-labels that are assigned to the unlabeled data. The graph thus evolves throughout our process.
Label Diffusion as Pseudo-labeling: Put simply, pseudo-labels are labels that are automatically generated for unlabeled data points. We adopt a hybrid approach that is distinct from traditional pseudo-labeling techniques: instead of deriving pseudo-labels directly from model predictions, our method infers them via an energy model (see Figure 2). This strategy provides some theoretical guarantees and allows us to enforce explicit certainty in our predictions.
We represent a given dataset as an undirected weighted graph \(\mathcal{G}=(\mathcal{V},\mathcal{E},W)\) that comprises a set of \(n\) nodes \(\mathcal{V}\) that are connected by a set of edges \(\mathcal{E}\) with weights \(W=(w_{ij})=(S(i,j))\), where \(S(i,j)\) measures the similarity between the features of nodes \(i\in\mathcal{V}\) and \(j\in\mathcal{V}\); here, \(S(i,j)\ge 0\) and \(S(i,j)= 0)\) if \((i,j)\notin \mathcal{E}\). For label functions \(u:\mathbb{R}^n\mapsto\mathbb{R}\), we define the normalized \(p\)-norm of the graph Laplacian as
\[\Delta^p(u)=\sum_{i,j}w_{ij}\left\Vert\frac{u_i}{d_i^{1/p}}-\frac{u_j}{d_j^{1/p}}\right\Vert^p, \enspace \textrm{with} \; p\ge 1 \; \textrm{and} \; d_i=\sum_j w_{ij}>0, \tag1\]
![<strong>Figure 3.</strong> Graph visualization of the Curated Breast Imaging Subset of the Digital Database for Screening Mammography (CBIS-DDSM). Figure courtesy of [1].](/media/kqshfkyl/figure3.jpg)
where \(d_i\) is the degree of node \(i\). Our scheme is based on the normalized, nonsmooth \(p=1\) \(p\)-Laplacian norm in \((1)\). We can rewrite this norm as \(\Delta^1(u)=|WD^{-1}u|\), where \(D\) is the diagonal matrix that contains the degrees \(d_i\). The \(m\times n\) matrix \(W\) encodes the \(m\) edges in the graph, each of which is represented on a different line of \(W\) such that the value \(w_{ij}\) (respectively \(-w_{ij}\) falls under column \(i\) (respectively \(j\)). The eigenfunctions of the graph Laplacian operator provide insight into the graph’s substructures.
We consider a multiclass setting; for each class \(k=1\dotsb L\), we set a variable \(u^k\) that contains the node values for class \(k\) and denote \(\mathbf{u}=[u^1,\dotsb u^L]\). For unlabeled nodes \(i>l\), we couple the \(L\) variables with the constraint \(\sum^L_{k=1} \, u^k_i=0\), \(\forall i >l\). We assume that a nonempty set of labeled nodes \(\mathcal{I}_k\subset \{1\dotsb l\}\) exists for each class \(k\), as is standard. For these nodes, we set \(u^k_i\ge \epsilon\) if \(i\in\mathcal{I}_k\) (positive response for the class) and \(u_i^{k'}\le -\epsilon\) if \(i\in\mathcal{I}_k\) and \(k' \ne k\) (negative output for the other classes). Given these constraints, we seek to minimize the multiclass functional [4] that contains the sum of normalized ratios: \(\min_{\Vert\mathbf{u}\Vert=1}\sum^L_{k=1} \frac{\Delta_1 u^k}{|u^k|}\). We then consider the following iterative scheme to optimize this problem:
\[\mathbf{u}^{(t+1)}=\underset{\mathbf{u}}{\textrm{argmin}}\frac{\Vert\mathbf{u}-\mathbf{u}^{(t)} \Vert^2}{2\Delta t}+\sum^L_{k=1}\left(\Delta_1(u^k)-\frac{\Delta_1(u^{k,(t)})}{|u^{k,(t)}|}\langle\textrm{sign}(u^{k,(t)}),u^k\rangle\right). \tag2\]
Here, \(t\) is a time index that is associated with the step \(\Delta t>0\). This process diffuses information from labeled to unlabeled nodes. To avoid trivial solutions [6], we apply shifting \(u^{k,(t+1)}=u^{k,(t+1)}-\textrm{median}(u^{k,(t+1)})\) and normalization \(\mathbf{u}^{(t+1)}=\mathbf{u}^{(t+1)}/\Vert\mathbf{u}^{(t+1)}\Vert\) steps at the end of each iteration.
Once \(\mathbf{u}^k\) converges to some \(\mathbf{u}^*=[u^{*,1},\dotsb,u^{*,L}]\), \(\hat{y}_i=\textrm{argmax}_j u_i^{*,j}\) finally gives the label of each node. In practice, we use an accelerated primal dual algorithm to solve the model in \((2)\). After the initial pseudo-label generation, a deep network updates the pseudo-labels iteratively to reduce uncertainty [1].
![<strong>Figure 4.</strong> Performance comparison of our approach (which utilizes 20 percent of labeled data) against state-of-the-art fully supervised techniques (which utilize 70 percent of labeled data). We report the area under the curve (AUC) per class and the average AUC over 14 pathologies. All compared techniques were performed with the official data split; the results in bold in the bottom right denote the highest performance. Figure courtesy of [1].](/media/j0hfi5lt/figure4.jpg)
Hybrid Models in Healthcare Applications
Our experiments address the challenges of medical image diagnosis, which include the prevalence of high-dimensional datasets and scarcity of labeled data. Here, we present several case studies of chest X-rays and mammograms to demonstrate the potential of hybrid modeling in the context of diagnosis.
The ChestX-ray14 dataset comprises 112,120 frontal chest view X-rays of size of 1,024 \(\times\) 1,024, consisting of 14 classes with diverse pathologies. Meanwhile, the Curated Breast Imaging Subset of the Digital Database for Screening Mammography (CBIS-DDSM) contains 3,103 mammography images with a mean size of 3,138 \(\times\) 5,220. These images represent normal, benign, and malignant cases with verified pathology information (see Figure 3).
![<strong>Figure 5.</strong> Area under the curve (AUC) performance comparison of hybrid semi-supervised classification with 35 and 40 percent of labels against existing state-of-the-art supervised techniques that use 85 percent of labels. Figure courtesy of [1].](/media/02ejxorh/figure5.jpg)
We compared our model’s performance on these datasets against existing semi-supervised and supervised techniques. To evaluate performance, we followed standard conventions in the medical domain by employing a receiver operating characteristic analysis and calculating the area under the curve (AUC) as a measure of quality. First, we evaluated our method against state-of-the-art supervised techniques based on the official partition of the ChestX-ray14 dataset. Figure 4 reports the resulting AUC per class and average over all classes, affirming that our approach readily competes with existing deep supervised techniques in per class performance. However, our method uses far fewer labels (only 20 percent) than all contrasted techniques (which are fully supervised and use 70 percent of labeled data).
Additionally, we assessed our method on the challenging CBIS-DDSM dataset [8] for mammogram classification and evaluated it against existing practices (see Figure 5). Compared with deep supervised techniques that use the official partition (85 percent of labeled data), our tactic demonstrated superior AUC scores despite using less than half of the labeled data of other techniques.
We also explored hybrid models and explainability in the context of COVID-19 diagnosis [3]. To address the limitations of probability scores, we utilized attention maps that focus on the lungs and compared them with human predictions (see Figure 6). By incorporating our tool into a user-friendly interface, we aim to ultimately help radiologists evaluate the accuracy of diagnoses and expedite the decision-making process.
![<strong>Figure 6.</strong> Attention maps on chest X-ray images that are overlaid with our prediction output (bottom) and the ground truth (GT) human consensus prediction (top). These maps highlight normal and abnormal regions, thus aiding radiologists in the decision-making process. Figure courtesy of [3].](/media/t1pj50ph/figure6.jpg)
Conclusions
Semi-supervised hybrid modeling embodies the strengths of both classic mathematical modeling and deep learning, offering a unique perspective that preserves theoretical guarantees while achieving higher performance than pure deep learning models [1]. These versatile hybrid models have tremendous potential in the healthcare industry, as they can leverage higher-order graph relations (such as hypergraphs) to enhance diagnosis and prognosis. Moreover, they are applicable to both single and multimodal data, thus paving the way for more advanced healthcare methodologies and unlocking new possibilities for improved patient care.
Carola-Bibiane Schönlieb delivered a minisymposium presentation on this research at the 2022 SIAM Conference on Mathematics of Data Science, which took place in San Diego, Calif., in September 2022.
References
[1] Aviles-Rivero, A.I., Papadakis, N., Li, R., Sellars, P., Alsaleh, S.M., Tan, R.T., & Schönlieb, C.-B. (2020). Energy models for better pseudo-labels: Improving semi-supervised classification with the 1-laplacian graph energy. Preprint, arXiv:1906.08635.
[2] Aviles-Rivero, A.I., Papadakis, N., Li, R., Sellars, P., Fan, Q., Tan, R.T., & Schönlieb, C.-B. (2019). GraphXNET — Chest X-ray classification under extreme minimal supervision. In Medical image computing and computer assisted intervention – MICCAI 2019: 22nd international conference (pp. 504-512). Shenzhen, China: Springer.
[3] Aviles-Rivero, A.I., Sellars, P., Schönlieb, C.-B., & Papadakis, N. (2022). GraphXCOVID: Explainable deep graph diffusion pseudo-labelling for identifying COVID-19 on chest X-rays. Pattern Recognit., 122, 108274.
[4] Bresson, X., Laurent, T., Uminsky, D., & von Brecht, J.H. (2013). Multiclass total variation clustering. In NIPS’13: Proceedings of the 27th international conference on neural information processing systems (Vol. 1) (pp. 1421-1429). Lake Tahoe, NV: Curran Associates Inc.
[5] Chapelle, O., Schölkopf, B., & Zien, A. (Eds.) (2006). Semi-supervised learning. Cambridge, MA: MIT Press.
[6] Feld, T., Aujol, J.-F., Gilboa, G., & Papadakis, N. (2019). Rayleigh quotient minimization for absolutely one-homogeneous functionals. Inverse Probl., 35(6), 064003.
[7] Iscen, A., Tolias, G., Avrithis, Y., & Chum, O. (2019). Label propagation for deep semi-supervised learning. In 2019 IEEE/CVF conference on computer vision and pattern recognition (CVPR). Long Beach, CA: Institute of Electrical and Electronics Engineers.
[8] Lee, R.S., Gimenez, F., Hoogi, A., Miyake, K.K., Gorovoy, M., & Rubin, D.L. (2017). A curated mammography data set for use in computer-aided detection and diagnosis research. Sci. Data, 4, 170177.
[9] Sellars, P., Aviles-Rivero, A.I., & Schönlieb, C.-B. (2024). LaplaceNet: A hybrid energy-neural network for deep semi-supervised classification. IEEE Trans. Neural Netw. Learn. Syst., 35(4), 5306-5318.
[10] Zhu, X., Ghahramani, Z., & Lafferty, J. (2003). Semi-supervised learning using Gaussian fields and harmonic functions. In Proceedings of the twentieth international conference on machine learning (ICML’03) (pp. 912-919). Washington, DC: AAAI Press.
About the Authors
Angelica Aviles-Rivero
Assistant professor, Tsinghua University
Angelica Aviles-Rivero is an assistant professor at the Yau Mathematical Sciences Center of Tsinghua University in China, where her research lies at the intersection of applied mathematics and machine learning. She seeks to develop mathematically grounded, data-driven algorithmic techniques to solve challenging, real-world problems. Aviles-Rivero’s research interests include graph learning, inverse problems for imaging, optimization, and AI for Science.

Carola-Bibiane Schönlieb
Professor, University of Cambridge
Carola-Bibiane Schönlieb is a professor of applied mathematics at the University of Cambridge, where she is head of the Cambridge Image Analysis Group. Her current research interests focus on variational methods, partial differential equations and machine learning for image analysis, image processing and inverse imaging problems, and the mathematical foundations of machine learning. Schönlieb is also a member of the SIAM Council.

Stay Up-to-Date with Email Alerts
Sign up for our monthly newsletter and emails about other topics of your choosing.
