
Forecasting U.S. Drug Overdose Mortality By Age
The drug epidemic in the U.S. remains a major crisis, with overdose deaths increasing fivefold since 1999 and surpassing 100,000 annual fatalities every year since 2020. According to the U.S. Centers for Disease Control and Prevention (CDC), peak mortality occurred in 2022 (during the COVID-19 pandemic) with 112,000 deaths, roughly 74,000 of which were due to fentanyl. The CDC tallied roughly 110,000 fatal overdoses in 2023, with 73,000 from fentanyl.
Several distinct "waves" of drug overdoses have been identified in the U.S., starting with the initial opioid prescription crisis of the late 1990s and followed by a heroin wave that emerged in the late 2000s, after regulations limited the prescription of opioid analgesics. The most recent wave is driven by fentanyl: a cheap, synthetic, and potent opioid that first appeared in the U.S. illegal drug market in 2013 [13]. A fourth wave is on the horizon, driven by polysubstance use and the mixing of stimulants (such as methamphetamines) and opioids—some even more potent than fentanyl—which often leads to unpredictable and deadly outcomes. These waves have disproportionately impacted some geographical regions and demographic groups (by age, sex, and race). For example, the mortality rate for Black males in Washington, D.C., in 2020 (134 fatalities per 100,000 people) was nine times higher than that of White males (14 fatalities per 100,000 people) [4].
The first step towards developing proper intervention strategies is to quantify and understand the problem. Both the CDC and the National Center for Health Statistics have systematically collected overdose mortality data since 1999. The dataset is publicly accessible via the CDC’s Wide-ranging Online Data for Epidemiologic Research (WONDER) portal; this portal is updated annually at the end of each calendar year with finalized data from the previous year, resulting in a one-year reporting lag.
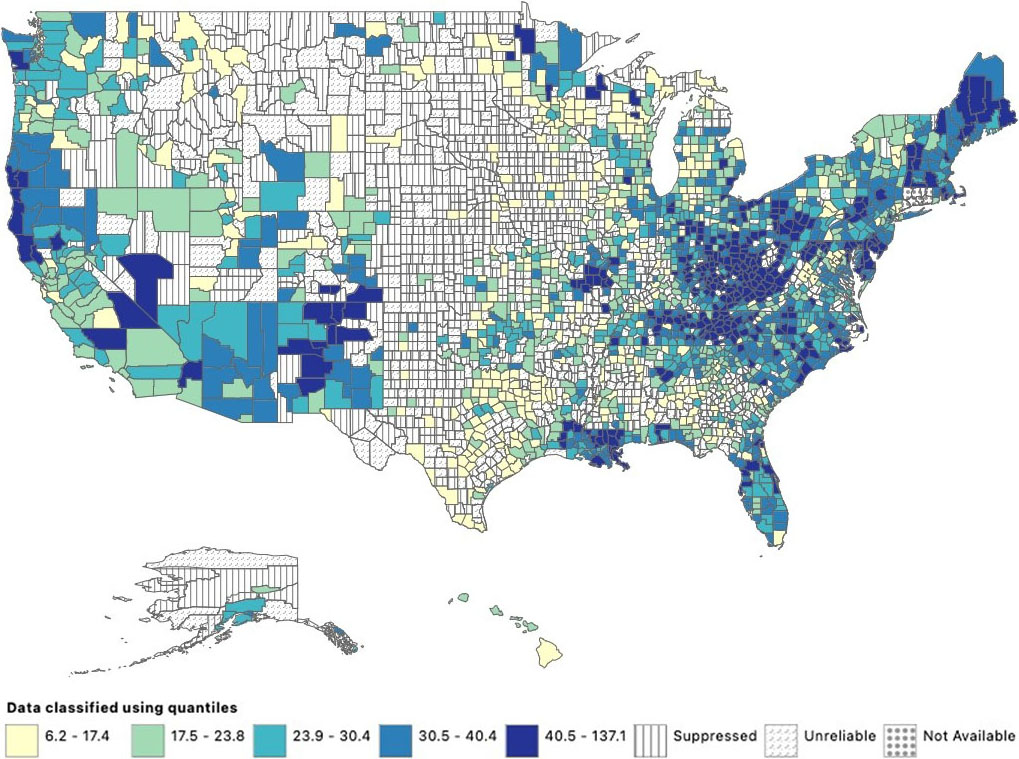
To date, most analytical or data-driven efforts have utilized the CDC WONDER portal or other similar databases to track past overdose deaths and provide valuable insights about the drug epidemic’s progression thus far [7]. A major step forward would be to build upon past data to generate forecasts of future trends and overdose patterns, thereby facilitating the development of targeted, specific prevention and preparedness tools. Given the demographic, political, and legislative differences across the U.S., forecasts at the local scale would be the most impactful to capture the unique drug market dynamics, socioeconomic conditions, cultural factors, and geohistorical attributes of a given region. Figure 1 depicts the spatial heterogeneity of drug-related mortality across the U.S.
To move beyond the study of historical trends, we developed a forecasting approach that merges observational data with mechanistic modeling [1, 2]. Our work is based on data assimilation techniques that originated in the geological and atmospheric sciences to produce weather and climate forecasts [3, 11]. These techniques enable the integration of high-dimensional dynamical systems with extensive datasets, and can incorporate interpretable parameters that relate to the underlying dynamics.
![<strong>Figure 2.</strong> Our approach uses an ensemble Kalman filter (EnKF) to combine a mechanistic model of drug overdose fatalities with corresponding observational data. Blue boxes show the main steps (i.e., projection and update) in an EnKF cycle, while green boxes represent the initial sample generation process and additional perturbations during the projection and update steps. Figure adapted from [3].](/media/zerl1ktm/figure2.jpg)
Specifically, we use an ensemble Kalman filter (EnKF) [6] to assimilate observational data on overdose mortality from the CDC WONDER database. We combine the EnKF with a structured population model based on Kermack–McKendrick theory [5, 8-10, 12] that describes an age-structured, drug-using population that includes individuals with substance use disorder as well as occasional or first-time users. The age-structured model allows us to define parameters that quantify interpretable processes, such as age-dependent initiation of high-risk substance use and drug-induced mortality. Figure 2 provides a schematic overview of our approach.
In Figures 3a and 3b, we illustrate the change in the U.S. general population and overdose fatalities from 1999 to 2021. Figure 3a shows the age-structured population distribution and evolution of two prominent population peaks—one that is currently between the ages of 20 and 30 and another between 50 and 60—while Figure 3b depicts the age distribution of fatal overdoses. From 1999 to 2014, the highest number of overdose deaths occurred in individuals between the ages of 40 and 50. However, from 2015 onwards, peak overdose fatalities began to occur at younger ages — between 35 and 40. Finally, a rapid rise in overdose deaths emerged in 2020, coinciding with the start of the COVID-19 pandemic. Knowledge of these trends informs the implementation of our age-structured mathematical model.
We use the mathematical model to predict the evolution of relevant system states in a series of iterative steps. At each step, new overdose fatality data are used to update theoretical state values and refine model estimates. The updated state values are then utilized for subsequent forecasts. Since finalized CDC WONDER data are available from 1999 onwards, forecasts for drug overdose fatalities in a given year \(Y\) are based on assimilated observational data from 1999 through \(Y-1\).
Figures 3c, 3d, and 3e display age-stratified overdose forecasts alongside corresponding observational data for the years 2001, 2011, and 2021. The nationwide forecasts closely align with the observed data. Despite the sudden, unforeseeable surge in overdose fatalities in 2020, the EnKF forecast for age-stratified overdose deaths in 2021 is consistent with reported fatality counts.
Because our method is tied to an underlying mechanistic model, we can define and analyze the evolution of key epidemiological parameters like drug-induced mortality rate. This rate has increased by a factor of almost six over the past two decades and now exceeds a staggering 1.1 percent per year among individuals who use high-risk drugs. We also find that drug overdose has become the leading cause of death in the under-60, high-risk drug-using population.
![<strong>Figure 3.</strong> Previous trends and forecasts of U.S. drug overdose fatalities. <strong>3a-3b.</strong> U.S. population and overdose deaths as a function of age and time between 1999 (light blue) and 2021 (dark blue). <strong>3c-3e.</strong> Forecasts of overdose deaths as a function of age for 2001, 2011, and 2021. Solid red curves and red shaded areas respectively indicate the mean predictions and 3\(\sigma\) (i.e., three standard deviation) intervals. Dashed black curves signify observed fatalities. Ages are binned in five-year intervals and prediction values are displayed at the center of each bin interval. Figure courtesy of [2].](/media/ynznimvk/figure3.jpg)
We applied our method to three representative areas—Los Angeles County in California, Cook County in Illinois, and the five boroughs of New York City—and found significant geographical variations in overdose fatality trends. For example, although the mortality rate among drug users in Los Angeles County in the early 2000s was higher than Cook County and New York City, its 2021 rate (at 0.5 percent per year) was lower than both Cook County (at 1.9 percent per year) and New York City (at 1.1 percent per year). The annual number of overdose deaths in Cook County and New York City has also increased much faster than in Los Angeles County in recent years, thus indicating a delayed but severe rise in drug overdoses — particularly in Cook County. Additional visualizations of both national- and state-level forecasts are available in the literature [2].
The data and our results paint a sobering picture that will undoubtedly be further complicated in the coming years by the introduction of new illegal drugs, such as carfentanyl, xylazines, and nitazenes. The generational shift toward drug use in younger individuals, geographical heterogeneity of drug overdose deaths, and evolving consumption and regulation patterns all emphasize the need for more focused intervention and prevention strategies. By providing near-term forecasts, quantifying epidemiological parameters, and capturing local overdose trends, our data assimilation approach has the potential to facilitate efforts to reduce drug-induced deaths in the U.S.
Lucas Böttcher delivered a contributed presentation and Maria R. D’Orsogna delivered a minisymposium presentation related to this research at the 2024 SIAM Conference on the Life Sciences, which took place in Portland, Ore., last year.
Acknowledgements: This work was supported by the U.S. Army Research Office through grant W911NF-23-1-0129.
References
[1] Böttcher, L., Chou, T., & D’Orsogna, M.R. (2023). Modeling and forecasting age-specific drug overdose mortality in the United States. Eur. Phys. J. Spec. Top., 232(11), 1743-1752.
[2] Böttcher, L., Chou, T., & D’Orsogna, M.R. (2024). Forecasting drug-overdose mortality by age in the United States at the national and county levels. PNAS Nexus, 3(2), pgae050.
[3] Brown, R.G., & Hwang, P.Y. (1997). Introduction to random signals and applied Kalman filtering: With MATLAB exercises and solutions (3rd ed.). New York, NY: John Wiley and Sons.
[4] D’Orsogna, M.R., Böttcher, L., & Chou, T. (2023). Fentanyl-driven acceleration of racial, gender and geographical disparities in drug overdose deaths in the United States. PLoS Glob. Public Health, 3(3), e0000769.
[5] Duan, X.-C., Li, X.-Z., & Martcheva, M. (2019). Dynamics of an age-structured heroin transmission model with vaccination and treatment. Math. Biosci. Eng., 16(1), 397-420.
[6] Evensen, G. (1994). Sequential data assimilation with a nonlinear quasi‐geostrophic model using Monte Carlo methods to forecast error statistics. J. Geophys. Res. Oceans, 99(C5), 10143-10162.
[7] Jalal, H., Buchanich, J.M., Roberts, M.S., Balmert, L.C., Zhang, K., & Burke, D.S. (2018). Changing dynamics of the drug overdose epidemic in the United States from 1979 through 2016. Science, 361(6408), eaau1184.
[8] Kermack, W.O., & McKendrick, A.G. (1927). Contributions to the mathematical theory of epidemics. Proc. R. Soc. A, 115(772), 700-721.
[9] Kermack, W.O., & McKendrick, A.G. (1932). Contributions to the mathematical theory of epidemics. II — The problem of endemicity. Proc. R. Soc. London A, 138(834), 55-83.
[10] Kermack, W.O., & McKendrick, A.G. (1933). Contributions to the mathematical theory of epidemics. III — Further studies of the problem of endemicity. Proc. R. Soc. London A, 141(843), 94-122.
[11] Law, K., Stuart, A., & Zygalakis, K. (2015). Data assimilation: A mathematical introduction. In Texts in applied mathematics (Vol. 62). Cham, Switzerland: Springer.
[12] M’Kendrick, A.G. (1925). Applications of mathematics to medical problems. Proc. Edinb. Math. Soc., 44, 98-130.
[13] U.S. Centers for Disease Control and Prevention. (2014, November 1). Understanding the opioid overdose epidemic. Retrieved from https://www.cdc.gov/overdose-prevention/about/understanding-the-opioid-overdose-epidemic.html.
About the Authors
Lucas Böttcher
Assistant professor, Frankfurt School of Finance and Management
Lucas Böttcher is an assistant professor of computational science at the Frankfurt School of Finance and Management and a courtesy professor at the University of Florida’s Laboratory for Systems Medicine. His research interests include dynamical systems theory, computational biology, statistical mechanics, and machine learning. Böttcher holds a Ph.D. in theoretical physics and applied mathematics from ETH Zürich.

Tom Chou
Professor, University of California, Los Angeles
Tom Chou is a professor in the Department of Computational Medicine and Department of Mathematics at the University of California, Los Angeles. His research interests include statistical physics, applied mathematics, and mathematical biology. Chou earned a Ph.D. in physics from Harvard University and held postdoctoral appointments at Cornell University, the University of Cambridge, and Stanford University.

Maria R. D’Orsogna
Professor, California State University, Northridge
Maria R. D’Orsogna is a professor of mathematics at the California State University, Northridge and a professor of computational medicine at the University of California, Los Angeles (UCLA). Her research interests include mathematical biology, statistical physics, and computational social science. D’Orsogna earned a Ph.D. in physics from UCLA, after which she held postdoctoral appointments at the California Institute of Technology and UCLA.

Stay Up-to-Date with Email Alerts
Sign up for our monthly newsletter and emails about other topics of your choosing.
